Wireshark Filters
Table of contents
1. Wireshark Filters For Beginners
3. Logical Wireshark Filter Operators
Wireshark Filters For Beginners
Wireshark has a huge variety of different filters. And there is a huge documentation devoted to these filters. This documentation is not easy to understand. I have compiled the most interesting Wireshark Filters for me - for novice users this can become something like a reference for Wireshark filters. By the way, here in the comments you can share filters that you like - I will add them to this list.
Remember that Wireshark has display filters and capture filters. Here I consider the display filters that are entered in the main window of the program in the top field below the menu and icons of the main functions.
To fully understand the importance of filters and their meanings, it is necessary to understand how the network works.
Some filters are written here in a general form, and some are made as literal examples. Remember that in any case you can substitute your data, for example, change the port number to any one of your interest, and also do the same with the IP address, MAC address, time value, etc.
Wireshark Filter Operators
Filters can have different values, for example, it can be a string, a hexadecimal format or a number.
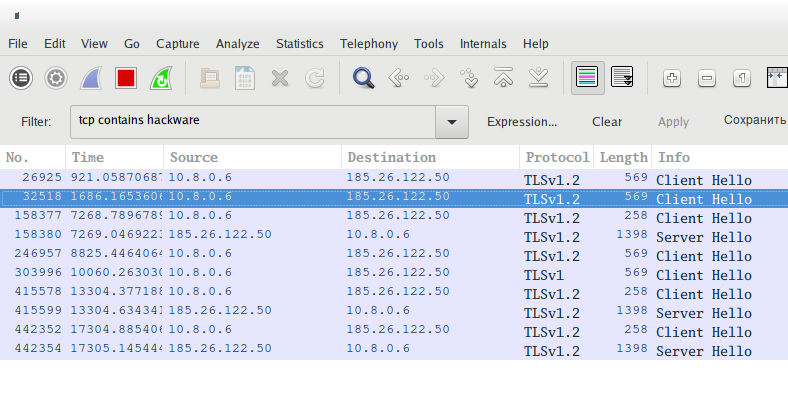
If an inaccurate entry is sought (better suited for non-numeric values) then contains is used. For example, to show TCP packets containing the string hackware you need the following filter:
tcp contains hackware
Operators are used to find exact values. Consider them:
| Operator |
Description |
|---|---|
| ==/eq | Equals |
| !=/ne | Not equal |
| </lt | Less than |
| <=/le | Less than or equal |
| >/gt | More than |
| >=/ge | Greater than or equal |
As you can see, there are two versions, for example, if we want to indicate that the filter value is equal to something, then we can use == or eq.
Filters using logical operands can be used to build rather complex structures, but apparently, usage of the same filter with comparison operators is buggy. For example, as here in an attempt to filter not one port, but the range of ports:
tcp.port>=8000 && tcp.port<=8180
But actually the filter value (in this case, tcp.port) is overwritten by the last value, so as a result, instead of the expected behavior, we get the result of only the last part, in this case it is
tcp.port<=8180
Keep in mind this bug!
When using with == (equal), this bug is missing.
Logical Wireshark Filter Operators
Logical operators allow you to create detailed filters using several conditions at once. It is recommended to use brackets additionally, because otherwise you may not get the result you expect.
| Operator | Description |
|---|---|
| AND/&& | Logical AND, data is output if they match to both parts of the filter. For example, the ip.src==192.168.1.1 and tcp filter will show only packets that originate from 192.168.1.1 and which are associated with the TCP protocol. Only data matching both conditions will be displayed. |
| OR/|| | Logical OR, it is enough that only one condition is true; if both are true, then this also fine. For example, the tcp.port==80 or tcp.port==8080 filter will show TCP packets that are related (are the source or destination) to port 80 or 8080. |
| NOT/! | Boolean is NOT used when we want to exclude some packages. That is, all packets will be shown, except those that satisfy the condition following the NOT. For example, the filter !dns will show all packets except DNS. |
Combination examples:
Show HTTP or DNS traffic:
http or dns
Show all traffic except ARP, ICMP and DNS:
!(arp or icmp or dns)
Interface Filters
Show packets only sent or received on the wlan0 interface:
frame.interface_name == "wlan0"
Link Layer Traffic
To show ARP traffic:
arp
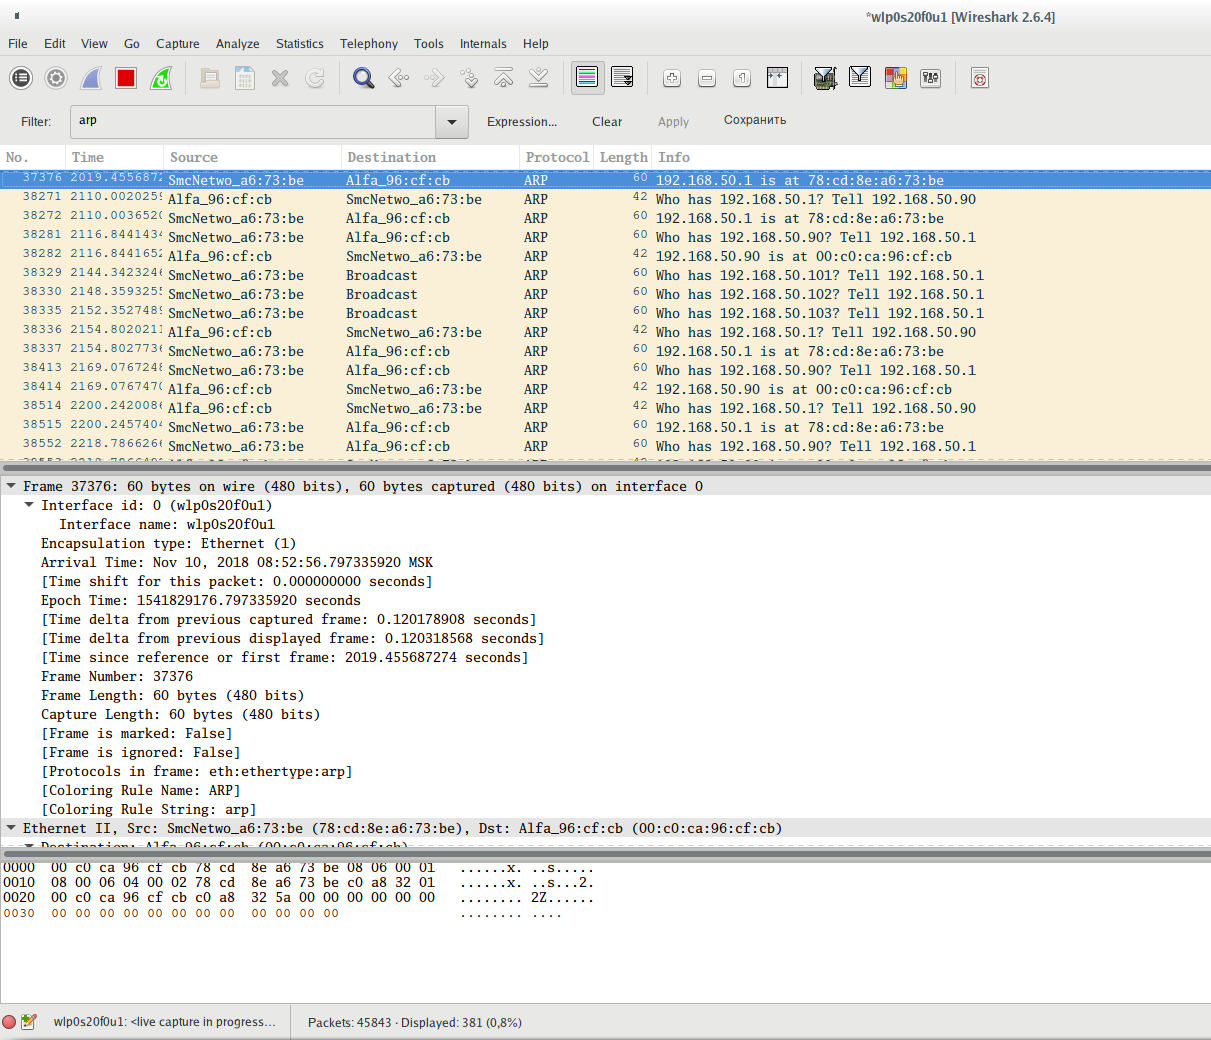
Show ARP protocol frames sent from device with MAC address 00:c0:ca:96:cf:cb:
arp.src.hw_mac == 00:c0:ca:96:cf:cb
Show ARP protocol frames sent from a device with an IP address 192.168.50.90:
arp.src.proto_ipv4 == 192.168.50.90
Show ARP protocol frames sent to a device with a MAC address 00:00:00:00:00:00 (this address is used when the protocol tries to find out the target MAC address. Another popular address that can confuse you is ff:ff:ff:ff:ff:ff, this is broadcast address, that is, messages with this address are for all devices on the local network):
arp.dst.hw_mac == 00:00:00:00:00:00
Show ARP protocol frames sent to the device having the IP address 192.168.50.1:
arp.dst.proto_ipv4 == 192.168.50.1
Show Ethernet traffic:
eth
Show frames (in general, all frames, not just ARP, as it was in the previous examples) sent from a device that has the MAC address 00:c0:ca:96:cf:cb:
eth.src == 00:c0:ca:96:cf:cb
Show frames sent to device with MAC address 78:cd:8e:a6:73:be:
eth.dst == 78:cd:8e:a6:73:be
Internet Layer Traffic
IPv4 Protocol Filtering
Show IP traffic (this includes TCP, UDP, as well as application layer protocols DNS, HTTP - that is, almost everything except the data link layer protocols that do not use IP addresses for data transmission (in local Ethernet networks they use MAC addresses)):
ip
More precisely, it means IPv4 traffic, which is usually called just IP (Internet Protocol).
Show traffic associated with a specific IP address (enter it instead of x.x.x.x). Packets will be shown in which this IP address is the source of the data OR the recipient:
ip.addr == x.x.x.x
Show traffic associated with these two IP addresses. According to the only possible situation, one of these addresses is the source, and the second is the destination address.
ip.addr == x.x.x.x && ip.addr == y.y.y.y
Show traffic originated from the host with the IP address 138.201.81.199:
ip.src == 138.201.81.199
Show traffic whose destination is the host with the IP address 138.201.81.199:
ip.dst == 138.201.81.199
Filter subnets and IP ranges in Wireshark
You can specify a subnet instead of a single IP address:
ip.addr == 192.168.1.0/24
Filtering traffic sent from a specific IP range. If you need to filter out traffic whose source is the subnet, then use a filter of the form:
ip.src == 192.168.1.0/24
Filtering traffic destined for sending to a specific IP range. If you need to filter traffic whose destination is a subnet, then use a filter of the form:
ip.dst == 192.168.1.0/24
Please note, IP protocol operates with IP addresses, but does not operate with ports. Ports are part of the TCP and UDP protocols. IP protocol is only responsible for routing traffic between nodes.
IPv6 Protocol Filtering
Show IPv6 (Internet Protocol Sixth Version) traffic:
ipv6
Filtering by IPv6 Address. To filter by IPv6 address, use the filter:
ipv6.addr == 2604:a880:800:c1::2ae:d001
Filtering Subnets and IPv6 Ranges in Wireshark
You can specify a subnet for filtering instead of a single IPv6 address:
ipv6.addr == 2604:a880:800:c1::2ae:d000/64
If you need to filter out traffic originating from a specific IPv6 address:
ipv6.src == 2604:a880:800:c1::2ae:d001
If you need to filter traffic sent to a specific IPv6 address:
ipv6.dst == 2604:a880:800:c1::2ae:d001
Filtering traffic sent from a specific IPv6 range. If you need to filter out traffic whose source is the subnet, then use a filter of the form:
ipv6.src == 2604:a880:800:c1::2ae:d000/64
Filtering traffic destined for sending to a specific IPv6 range. If you need to filter traffic whose destination is a subnet, then use a filter of the form:
ipv6.dst == 2604:a880:800:c1::2ae:d000/64
Filtering ICMPv6 (Internet Control Message Protocol of the sixth version) in Wireshark is done by the filter:
icmpv6
How to filter ARP packets for IPv6 in Wireshark? For IPv6, ARP is not required, since its role is played by the Neighbor Discovery Protocol (NDP) using ICPM6.
To see packets that act as ARP for IPv6, use a filter:
icmpv6.type == 133 or icmpv6.type == 134 or icmpv6.type == 135 or icmpv6.type == 136 or icmpv6.type == 137
Other filters with an IP address are similar for IPv6 and IPv4.
Transport Layer Traffic
To see only TCP traffic:
tcp
Show traffic whose source or destination port is a specific port, for example, 8080:
tcp.port==8080
Show traffic originating from port 80:
tcp.srcport == 80
Show the traffic that is sent to the service listening on port 80:
tcp.dstport == 80
Show TCP packets with the SYN flag enabled:
tcp.flags.syn==1
Show TCP packets with the SYN flag enabled and the ACK flag disabled:
tcp.flags.syn==1 && tcp.flags.ack==0
Similarly for other flags:
- SYN
tcp.flags.syn==1
- ACK
tcp.flags.ack==1
- RST
tcp.flags.reset==1
- FIN
tcp.flags.fin==1
- CWR
tcp.flags.cwr==1
- ECE
tcp.flags.ecn==1
- URG
tcp.flags.urg==1
- PSH
tcp.flags.push==1
- NS
tcp.flags.ns==1
You can also use syntax like tcp.flags == 0x0XX, for example:
- FIN is tcp.flags == 0x001
- SYN is tcp.flags == 0x002
- RST is tcp.flags == 0x004
- ACK is tcp.flags == 0x010
- ACK and FIN set simultaneously is tcp.flags == 0x011
- ACK and SYN set simultaneously is tcp.flags == 0x012
- ACK and RST set simultaneously is tcp.flags == 0x014
Data Offset:
tcp.hdr_len == 32
tcp.hdr_len == 52
tcp.hdr_len > 32
Packets with reserved bits set:
tcp.flags.res == 1
Window size:
tcp.window_size_value == 11
tcp.window_size_value == 4468
tcp.window_size_value > 65000
tcp.window_size_value < 100
Calculated window size:
tcp.window_size == 45056
tcp.window_size == 11
Window size scaling factor:
tcp.window_size_scalefactor == 4096
The tcp.window_size_value is the raw window size value as read directly from the TCP header, whereas tcp.window_size is the calculated window size, which is based on whether window scaling is applicable or not. If window scaling is not used or the scaling factor is 1 or if it's unknown whether window scaling is applicable or not because the TCP 3-way handshake was not captured, then the two values will be the same. You can tell by the tcp.window_size_scalefactor which of these conditions is applicable - if its value is -1, then it's unknown, if its value is -2, then window scaling is not used, and all other values represent an actual window scaling size factor.
To show packages containing any string, for example, the hackware string:
tcp contains hackware
Follow TCP stream number X:
tcp.stream eq X
Filter by stream number:
tcp.seq == x
Show transmitted packets. Helps track application performance and packet loss:
tcp.analysis.retransmission
This filter displays problematic packets (lost segments, transmiting, etc.) TCP Keep-Alive packets pass this filter, but they are not an indication of problems.
tcp.analysis.flags
Filters to assess the quality of a network connection.
The following specifications apply to TCP frames. Moreover, they are not based on frame headers – the considered characteristics (data omission, duplicates) are assigned by the Wireshark program based on the analysis.
The filter displays information about frames with the ACK flag, which are duplicates. A large number of such frames may be a sign of communication problems:
tcp.analysis.duplicate_ack_num == 1
Show frames for which the previous segment is not captured:
tcp.analysis.ack_lost_segment
This is normal at the beginning of data capture – because the information is not intercepted from the very beginning of the session.
To display frames that are retransmission (resend):
tcp.analysis.retransmission
Show frames that are not received in the correct order:
tcp.analysis.out_of_order
To see only UDP traffic:
udp
Flags are not used for UDP. For this protocol, you can only specify the port.
Show traffic originating from port 53:
udp.srcport == 53
Show the traffic that is sent to the service listening on port 53:
udp.dstport == 53
A UDP packet containing a specific string, for example, a hackware string:
udp contains hackware
Destination Port OR Source Port:
udp.port == 53
udp.port > 40000
udp.port < 30
Package Length:
udp.length == 60
udp.length > 50000
Time between packets (to identify network problems):
udp.time_delta > 1.5
Stream Number (Request-Response):
udp.stream == 5
Traceroute packages:
udp.possible_traceroute
To see only ICMP traffic:
icmp
To see only ICMP v6 traffic (sixth version)
icmpv6
Show all answers to ping:
icmp.type==0

Show all ping requests:
icmp.type==8
Show all unreachable/prohibited host and port errors
icmp.type==3
Show all attempts to redirect routing using ICMP:
icmp.type==8
Other ICMP types and CODE options are here: https://www.frozentux.net/iptables-tutorial/iptables-tutorial.html#TCPOPTIONS
An example of using the CODE value, the following filter will show messages about the port unreachable:
icmp.type == 3 && icmp.code == 3
Application layer traffic
For the application protocols of HTTP, DNS, SSH, FTP, SMTP, RDP, SNMP, RTSP, GQUIC, CDP, LLMNR, SSDP there are filters that are called like the protocols themselves, but are written in small letters.
For example, to see HTTP traffic:
http
To see the traffic of the new HTTP/2 protocol:
http2
Remember that when deciding which protocol the transmitted data belongs to, the program considers the used port number. If a non-standard port is used, the program will not be able to find the necessary data. For example, if you connect to SSH on port 1234, the ssh filter will not find SSH traffic.
A filter that shows only the data sent by the POST method:
http.request.method == "POST"
A filter that shows only the data transmitted by the GET method:
http.request.method == "GET"
Search for requests to a specific site (host):
http.host == "<URL>"
Search requests to a specific site by part of the name:
http.host contains "here.particle.name"
Filter for outputting HTTP requests in which cookies were transmitted:
http.cookie
Requests in which the server has set cookies in the user's browser.
http.set_cookie
To search for any transferred images:
http.content_type contains "image"
To search for certain types of images:
http.content_type contains "gif"
http.content_type contains "jpeg"
http.content_type contains "png"
To search for files of a specific type:
http.content_type contains "text"
http.content_type contains "xml"
http.content_type contains "html"
http.content_type contains "json"
http.content_type contains "javascript"
http.content_type contains "x-www-form-urlencode"
http.content_type contains "compressed"
http.content_type contains "application"
Search for requests for files of a certain type. For example, to search for transferred ZIP archives:
http.request.uri contains "zip"
Instead of http.request.uri for greater accuracy, you can use the http.request.uri.path or http.request.uri.query filters, for example, to search for requests to download JPG files (links to pictures):
http.request.uri.path contains "jpg"
You can also filter requests that contain a specific HTTP REFERRER header value. For example, to search for queries in which the referrer is ru-board.com:
http.referer contains "ru-board.com"
Search requests with any authorization. Similarly, with the help of contains you can search for certain types of authorization:
http.authorization
Search for files in the HTTP stream:
http.file_data
To see which HTTP data is delayed, use the following construct:
http.time>1
It will show traffic received after 1 second.
To investigate problems, you can analyze the status of HTTP response codes. For example, the following filter will show traffic for which a 404 Not Found error was received (page not found):
http.response.code==404
The following filter is very interesting. Firstly, it shows which complex structures can be built from separate filters. Secondly, it allows you to explore HTTP requests and overall web activity, eliminating unnecessary data. With this filter you can view high level web activity. The rules inside the brackets exclude images, JavaScript files and style sheets — everything embeded the page requests within itself. If the examined pages contain other embedded objects, exclude them in a similar way:
http.request && !(http.request.uri contains ".ico" or http.request.uri contains ".css" or http.request.uri contains ".js" or http.request.uri contains ".gif" or http.request.uri contains ".jpg")
Filtering HTTP header fields: some filters discussed just above are already related to HTTP header filters, let's look at a few more examples.
Remember that you can use the filter without specifying the desired value, for example:
http.host
In this case, all connections with any Host field value in the HTTP header will be shown.
You can specify the exact value:
http.host == "www.archlinux.org"
Or specify part of the desired string:
http.host contains "archlinux.org"
Filter by Host field in HTTP header:
http.host == "www.archlinux.org"
Filter by the Content-Type field in the HTTP header:
http.content_type == "text/plain"
Filter by Server field in HTTP header:
http.server == "nginx"
Filter by Cookie field in HTTP header:
http.cookie
http.cookie_pair
Filter by User Agent field in HTTP header:
http.user_agent == "Mozilla/5.0 (X11; Linux x86_64; rv:82.0) Gecko/20100101 Firefox/82.0"
Filter by the X-Powered-By field in the HTTP header:
http.x_forwarded_for
To search for redirects (Location field):
http.location
To search for sites from which a transition was made to the page (Referer field):
http.referer contains "miloserdov.org"
Request filter:
http.request
http.request.uri
http.request.uri.path
http.request.uri.query.
http.request.uri.query.parameter
http.request.method
Response filters:
http.response
Search by response code:
http.response.code == 404
http.response.code != 200
In fact, this list is far from complete. You can use the hints that appear as you type the names of the filters, or you can be guided by the names of the HTTP header fields, which are similar to the names of the filters.
To show only TLS based traffic (encrypted data):
tls
Handshake protocol:
tls.handshake
Certificates:
tls.handshake.certificates
Search by content of certificates:
tls.handshake.certificate contains "*.hackware.ru"
There are many TLS filters, but you need to understand that we cannot search by the content of the encrypted data being transmitted (for obvious reasons, the data is encrypted). You can search by various properties, as well as unencrypted content, such as certificates.
To see all DNS queries and answers:
dns
To see which DNS queries took a lot of time:
dns.time>1
The answers that came more than a second after sending the request will be shown.
This filter shows which dns requests cannot be correctly resolved:
dns.flags.rcode != 0
Show only DNS queries:
dns.flags.response == 0
Show only DNS responses:
dns.flags.response == 1
Show requests and responses in which the IP for google.com is searched:
dns.qry.name == "google.com"
Show DNS requests and responses for A record:
dns.qry.type == 1
Show DNS requests and responses for AAAA records:
dns.qry.type == 28
Show answers in which 216.58.196.3 is sent for the A record as IP:
dns.a == 216.58.196.3
Show replies in which 2a01:4f8:172:1d86::1 sent to the AAAA as IP
dns.aaaa == 2a01:4f8:172:1d86::1
Find certain value (apollo.archlinux.or) of CNAME:
dns.cname == "apollo.archlinux.org"
Show answers longer than 30:
dns.resp.len > 30
Show requests with a length of more than 25:
dns.qry.name.len >25
Show DNS server responses for which recursion is available:
dns.flags.recavail == 1
Show DNS server responses for which recursion is not available:
dns.flags.recavail == 0
Is recursion desirable (if the requested DNS server does not have host name information, should it query other DNS servers for this information):
dns.flags.recdesired == 1
If 1 is set, then recursion is needed, if 0 is set, then it is not desirable.
Whether to accept unauthenticated data (0 means do not accept, 1 means accept):
dns.flags.checkdisable == 0
To see how IP addresses are assigned by DHCP:
udp.dstport==67
Or so:
bootp.option.dhcp
To show DHCP requests:
bootp.option.dhcp == 3
To show DHCP Discover:
bootp.option.dhcp == 1
SMB filter. This filter in the Info column shows the entire Share of connections, open directories and open files in the trace.
smb2.cmd==3 or smb2.cmd==5
NetBIOS filters
Wireshark Filter for Name Service (NetBIOS-NS):
nbns
Wireshark Filter for Datagram Distribution Service (NetBIOS-DGM):
nbdgm
Wireshark Filter for Session Service (NetBIOS-SSN):
nbss
VNC
To show only VNC session traffic:
vnc
VNC challenge:
vnc.auth_challenge
VNC response:
vnc.auth_response
The result of an authentication attempt on the VNC server:
vnc.auth_result
The challenge, response, and result of an authentication attempt on a VNC server:
vnc.auth_challenge or vnc.auth_response or vnc.auth_result
Computer Name with VNC Server:
vnc.desktop_name
Mouse button position:
vnc.button_1_pos
vnc.button_2_pos
…………...
vnc.button_8_pos
Security Type Selected:
vnc.client_security_type
Encoding Type:
vnc.client_set_encodings_encoding_type
VNC client protocol version:
vnc.client_proto_ver
VNC server protocol version:
vnc.server_proto_ver
Framebuffer Width:
vnc.width
Key:
vnc.key
Key down:
vnc.key_down
Data of transmitted video in H.264 format:
vnc.h264_data
Cut text:
vnc.client_cut_text
Other VNC filters: https://www.wireshark.org/docs/dfref/v/vnc.html
Remote Desktop Protocol (RDP)
To show only RDP session traffic:
rdp
Other Remote Desktop Protocol (RDP) filters: https://www.wireshark.org/docs/dfref/r/rdp.html
Wireshark Filters for HTTP Basic and Digest Authentication
Wireshark can filter authentication sessions. The following filters are available for this:
All authentication sessions (BASIC/DIGEST/NTLM):
http.authorization
HTTP Basic authentication only:
http.authbasic
HTTP Basic only authentication with specific credentials:
http.authbasic == "LOGIN:PASSWORD"
Wireshark filters to analyze traffic through a web proxy server
This filter will show requests from the proxy for HTTP Digest authentication:
http.proxy_authenticate
This filter will show the credentials sent by the client to the proxy server for authorization:
http.proxy_authorization
Show requests made through a proxy server (HTTP CONNECT method):
http.request.method == "CONNECT"
Since web proxies use HTTP Basic and Digest authentication to authenticate users, you can use the appropriate Wireshark filters. All authentication sessions (BASIC/DIGEST/NTLM):
http.authorization
HTTP Basic authentication only:
http.authbasic
HTTP Basic only authentication with specific credentials:
http.authbasic == "LOGIN:PASSWORD"
Digest Authentication Request from Proxy:
http.proxy_authenticate contains "Digest"
User response sent to the proxy server with information for Digest authorization:
http.proxy_authorization contains "Digest"
Filters for Wi-Fi frames
Show elements of four-ways handshakes (i.e. EAPOL protocol frames):
eapol
Show Beacon frames:
wlan.fc.type_subtype == 0x08
Show Probe Response frames:
wlan.fc.type_subtype == 0x05
Show all at once: EAPOL, beacons, Probe Response:
wlan.fc.type_subtype == 0x08 || wlan.fc.type_subtype == 0x05 || eapol
Show wireless frames for a specific device with the BSSID MAC address:
wlan.addr==BSSID
Show EAPOL, Beacons, Probe Response for a specific device with a MAC address of 28:28:5D:6C:16:24:
(wlan.fc.type_subtype == 0x08 || wlan.fc.type_subtype == 0x05 || eapol) && wlan.addr==28:28:5D:6C:16:24
Show all PMKID:
eapol && wlan.rsn.ie.pmkid
Or:
wlan.rsn.ie.pmkid
Show PMKID with a specific value:
wlan.rsn.ie.pmkid == 21:89:fa:52:75:df:e9:f5:56:f3:2e:e5:4b:86:b7:8f
Show PMKID, Beacons, Probe Response:
(wlan.fc.type_subtype == 0x08 || wlan.fc.type_subtype == 0x05 || (eapol && wlan.rsn.ie.pmkid))
Show PMKID, Beacons, Probe Response for access point with MAC address 40:3D:EC:C2:72:B8:
(wlan.fc.type_subtype == 0x08 || wlan.fc.type_subtype == 0x05 || (eapol && wlan.rsn.ie.pmkid)) && wlan.addr==40:3D:EC:C2:72:B8
Show only the first message of the handshake:
wlan_rsna_eapol.keydes.msgnr == 1
Show only the second message of the handshake (can be used for the handshake Message of any number):
wlan_rsna_eapol.keydes.msgnr == 2
Show frames for access points with a speed (Data Rate) of 1 Mb/s:
wlan_radio.data_rate == 1
Show frames for access points at speeds above 10 Mb/s:
wlan_radio.data_rate > 10
Show data related to frequencies in the 2 GHz band:
radiotap.channel.flags.2ghz == 1
Show data related to 5 GHz frequencies:
radiotap.channel.flags.5ghz == 1
Show captured data on a specific channel:
wlan_radio.channel == 44
Show access points on a specific frequency:
radiotap.channel.freq == 2412
Show access points with a certain signal level:
wlan_radio.signal_dbm > -50
Filters associated with the presence of an antenna on a device:
radiotap.present.antenna == 1
and
radiotap.antenna == 1
If you know other interesting Wireshark filters, please share them in the comment section.
Display Filter Reference: IEEE 802.11 Radiotap Capture header: https://www.wireshark.org/docs/dfref/r/radiotap.html
Related articles:
- Introduction to IPv6 Addresses: How to Use and How to Explore the Network (Part 2) (50%)
- Attacks targeting proxy servers (46.6%)
- How to intercept and analyze traffic in open Wi-Fi (45.3%)
- How to capture a Wi-Fi handshake in tcpdump (45.3%)
- Rogue Wi-Fi AP with mitmAP: setting up and data analysis (44.7%)
- How to find out the exact model of a router (wireless access point) (RANDOM - 4%)