How to analyze POST requests in web browsers
Modern websites are becoming more complex, using more and more libraries and web technologies. For debugging purposes, developers of complex websites and web applications required new tools. They are “Developer Tools” integrated into the web browsers themselves:
- Chrome devtools
- Firefox Developer Tools
They come with browsers by default (Chrome and Firefox) and provide many options for testing and debugging sites for a variety of conditions. For example, you can open a website or launch a web application as if it works on a mobile device, or simulate mobile network lags, or simulate application went offline, you can take a screenshot of the entire site, even for large pages that require scrolling, etc. In fact, Developer Tools require in-depth study in order to truly understand their full power.
In previous articles, I have already considered several practical examples of using DevTools tools in a browser:
- Static analysis of the source code of the website in the browser
- Analysis of sites dynamically generated using JavaScript and sites with loadable content (search for links to video, images, downloadable content)
This small article is devoted to the analysis of POST requests. We will learn to view the data sent by the POST method right in the web browser itself. We will learn how to get them in their source (“raw”) form, as well as in the form of variable values.
I will show the example of the http://spys.one/en/free-proxy-list/ site from the article about proxy. (Actually, this is the simplest example – as more complex examples, try to figure it out yourself, for example, in POST GMail when opening and other actions with emails).
A fragment of the source code of the page shows that the data from the form is sent using the POST method, and the onChange="this.form.submit();" construction is used:
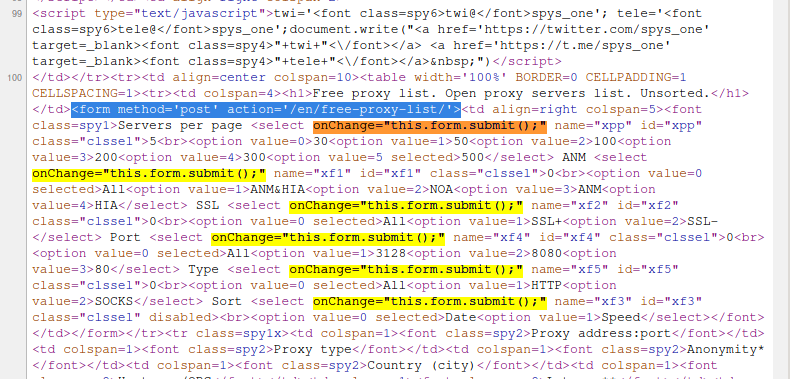
For example:
<select onChange="this.form.submit();" name="xpp" id="xpp" class="clssel">5<br>
    <option value=0>30
    <option value=1>50
    <option value=2>100
    <option value=3>200
    <option value=4>300
    <option value=5 selected>500
</select>
Despite the unusual solution – there is no “Submit” button, and data is sent with any change of the <select> field, this is quite a simple example that can be analyzed by a static code – that is, you can collect the names of all <select>, collect their values string. But I suggest to get acquainted with a much faster way of analysis.
How to see POST data in Google Chrome
So, we open (or refresh if it is already open) the page from which we want to know the data sent by POST. Now open the developer tools (in previous articles I wrote how to do it in different ways, for example, I just press F12):
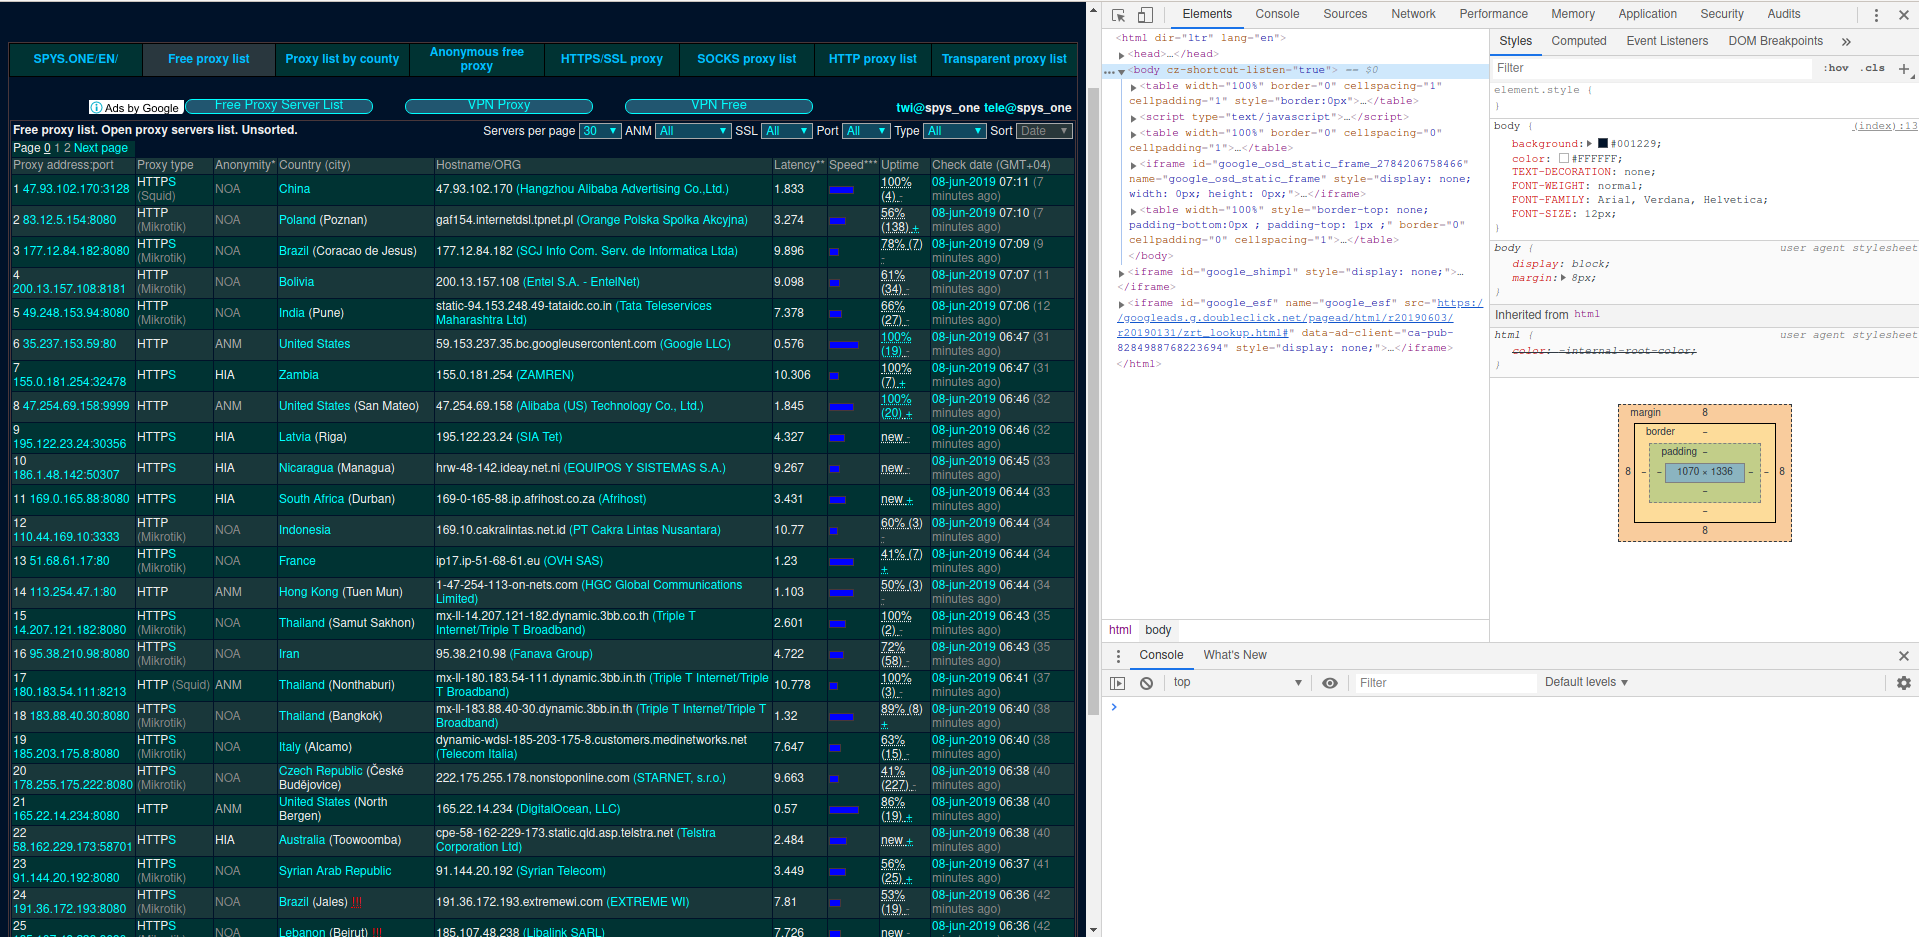
Now send the data using the form.
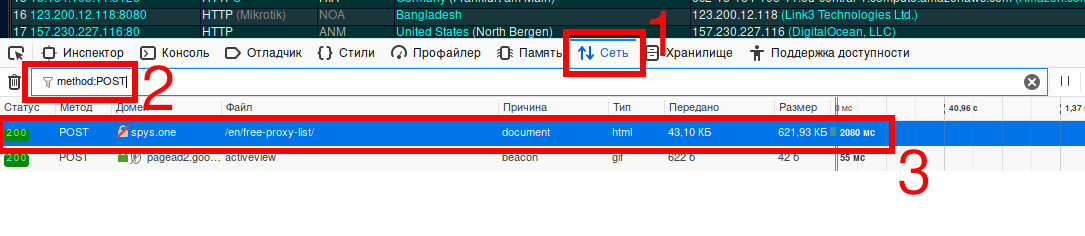
Go to the “Network” tab, click on the “Filter” icon and enter method:POST as the filter value:

As can be seen in the previous screenshot, one request was made using the POST method, we click on it:

Columns:
- Header – all HTTP headers
- Preview of what we received after the rendering (the same is shown on the site page)
- Response – that the site sent in response to our request
- Cookies
- Timing
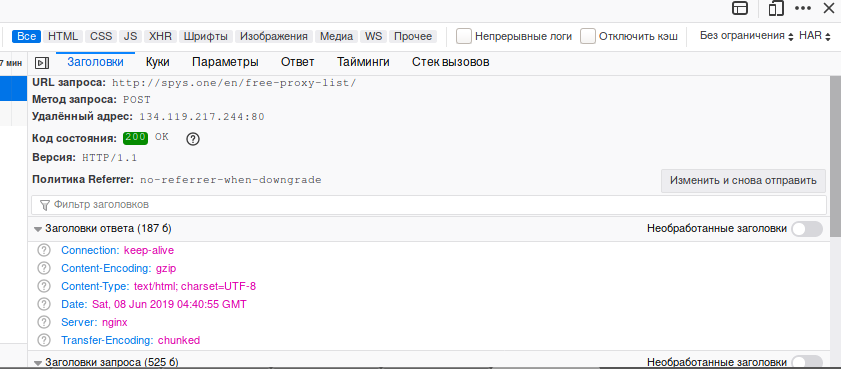
Since we need to see the data sent by the POST method, we are interested in the Header column.
There are various useful data, for example:
- Request URL – the address where the information from the form is sent
- Form Data – sent values
Scroll to Form Data:
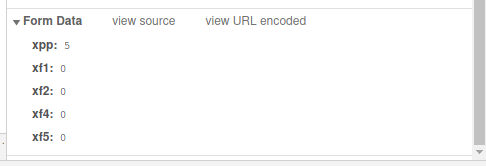
There we see five variables sent and out of value.
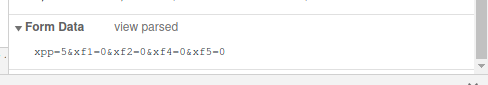
If you click on ‘view source’, then the sent data will be shown as a string:
xpp=5&xf1=0&xf2=0&xf4=0&xf5=0
The “view parsed” is the default view, in which the transferred variables and their values are shown to us in a human-readable form.
How to see the data transferred by the POST method in Firefox
In Firefox, everything happens in a very similar way.
Open or refresh the page you need.
Open the Developer Tools (F12).
We send the data from the form.
Go to the ‘Network’ tab and insert method:POST as a filter:
Click on the request you are interested in and in the right part a window will appear with additional information about it:
You will see the values passed in the form if you open the ‘Parameters’ tab:

If you want to receive the sent data as a string, then go back to the “Headers” tab and click the “Change and send again” button, in the opened area, scroll to “Request Body”:

As you already understood, here you can not only copy the POST line, but also edit it and send the request again.
Other Developer Tool Filters
For Chrome, in addition to the method:POST already reviewed, the following filters are available:
- domain
- has-response-header:
- larger-than:
- method:GET
- method:OPTIONS
- method:POST
- mime-type:
- mixed-content:
- priority:
- scheme:
- set-cookie-domain:
- set-cookie-name:
- set-cookie-value:
- status-code:
Related articles:
- lulzbuster: a tool for quick enumeration of hidden files and folders on sites (58.6%)
- Security audit of the SKYWORTH GN542VF router – how to hack the admin panel password without leaving the web browser! (57.7%)
- How to use User Agent to attack websites (56.7%)
- JavaScript Attacks (53.1%)
- sqlmap usage guide. Part 1: Basic web-site checks (GET) (51.1%)
- How to find web server virtual host (RANDOM - 51.1%)