Tracerouting tools and methods
Table of contents
1. What is trace routing. Why do we need tracing routes
5.3 How to speed up tracing. How to disable reverse IP to host name translation during tracing
5.5 How to change port for tracing
5.6 How to start tracing from a specific hop. How to reduce or increase the number of hops to trace
5.7 Select interface for tracing
5.8 How to show which autonomous system the node belongs to when tracing
7. mtr and mtr-gtk (console and graphic version)
What is trace routing. Why do we need tracing routes
Network trace routing shows all intermediate nodes through which a packet passes until it reaches the specified target. That is, using tracing, you can find out which nodes, with which IP addresses, the packet is transmitted before being delivered to the destination point.
Tracing can be used to identify problems associated with the operation of a computer network, as well as to discover the network (determine the network structure, search for intermediate network nodes).
How tracing routes works
Network packets consist of two parts: headers and data. There are different information in the headers, for example, the IP addresses of the source and destination, the ports of source and destination, the type of packet, the checksum of the packet, and so on. Among the header fields, the IP protocol has a field like time to live (TTL). This is a counter with a number that is decremented by one each time a packet passes a new node. This counter is made to ensure that the problem package (for example, in case of an error that caused a looped route) does not travel around the network indefinitely. That is, any packet having passed a certain number of nodes will eventually reach the destination host or be dropped by one of the network nodes when the time to live ends.
When the TTL counter becomes zero, the next gateway simply does not forward the packet further. But at the same time, the gateway to the IP address where the packet with the expired lifetime came from, sends the response TIME_EXCEEDED using the ICMP protocol. And this answer contains the IP address of the gateway where the packet ended its existence.
So, the essence of tracing is that one packet is sent with a TTL set to one — the first gateway decreases the value by one, looks that the counter has become zero, does not send this packet anywhere, but sends us the answer that ‘the packet has died’. We already know that the packet is dead – from this answer we are only interested in the IP address of the gateway where this misfortune happened to the packet. Then the packet with the TTL counter set to 2 is sent – the packet passes the first gateway (we already know its IP), but the misfortune (the counter reaches zero) happens to it at the second gateway – we get an ICMP response with that gateway’s IP. Then the next packet is sent, and so on, until all nodes to the remote host of interest are identified.
Trace route types
There are several types of tracing. Basically, they differ in the packet being sent – it can be a TCP or UDP transport protocol packet, or an ICMP Internet Control Message Protocol, or a raw IP packet.
Sometimes, due to firewalls or the configuration of network nodes, it is not possible to obtain the IP address of the node. In this case, you can try to use another method that can give results.
This can be illustrated in the following two examples of tracing to the same host:
traceroute hackware.ru
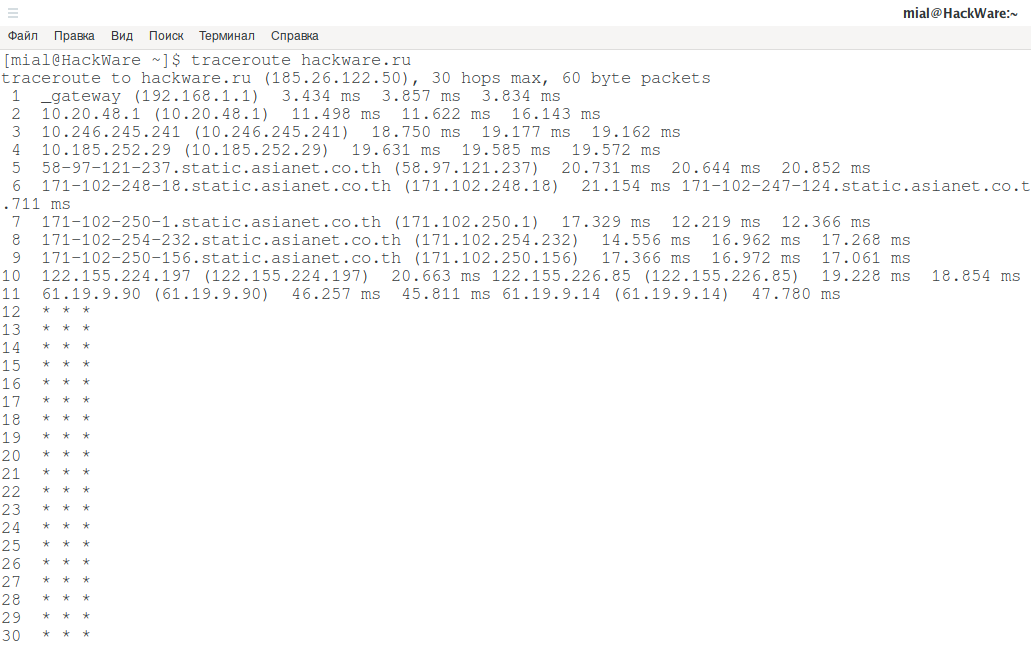
Asterisks say that we did not get to know some of the nodes.
sudo traceroute -I hackware.ru
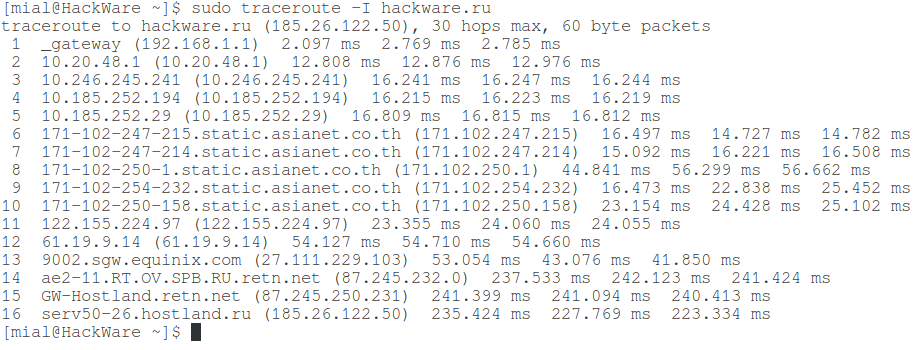
By changing the tracing method, it was possible to find out all intermediate nodes. Other methods may give different results.
Some programs allow you to select the tracing method, change the port number, and also set the values of some fields in the packet header.
Tracing software
There are many different utilities for tracing, some of which support various tracing methods. Examples of such programs:
- traceroute
- tracepath
- mtr and mtr-gtk (console and graphic versions, respectively)
- lft
- tcptraceroute
You can also tracing routes using Nmap (in several ways) and even using ping!
In this article I will consider all the above programs. Let's start with the traceroute, because it implements the most scanning methods.
traceroute
How to use traceroute
To start a trace, it is enough to specify the IP or the site to which you want to trace the route:
traceroute IP_or_domen-name
If you are interested in the nearest nodes (local network, for example), then you can choose any site as a destination.
Traceroute methods
In today's networked environments, traditional tracing methods are not always applicable due to the wide usage of firewalls. Such firewalls filter ‘unlikely’ UDP ports or even ICMP echo packets. To solve this problem, some additional network tracing methods (including tcp) are implemented. These methods attempt to use other protocols and source/destination ports to bypass firewalls (so that firewalls perceive them as just the beginning of a network session of an allowed type).
Different methods have options specific to them – they depend on the protocol used. These method options can be specified with the -O option. Multiple options are separated by commas (or use several -O on the command line). Each method may have its own particular options or may not have at all.
default
The default method is used unless otherwise specified, or you can specify it explicitly with the -M default option. This is a traditional, ancient route tracing method.
The probing packets are udp datagrams with the so-called ‘unlikely’ destination port. The first ‘unlikely’ probe port is 33434, then for each subsequent probe it is increased by one. Since it is expected that the port is not used, the destination host usually returns the final ‘icmp unreach port’ response. Port number can be changed (about it below).
This method can perform unprivileged users.
icmp
Now it is the most typical method, it uses icmp echo packets as probes. If you can ping the destination host, then icmp tracing is also applicable. To select this method, use the -M icmp option or its short -I option.
This method is allowed for unprivileged users.
This method has two specific options.
raw
Use only raw sockets (the traditional way).
By default, this method is tried first (for compatibility reasons), then new dgram icmp sockets as a backup option.
dgram
Only use dgram icmp sockets
tcp
A well-known modern method, designed to bypass firewalls. To use, specify the -M tcp option or the short -T option. Uses a fixed destination port (default is 80, http).
If there are any filters on the network tracing path, it is highly likely that “unusual” udp ports are filtered (such as is used by the default method) or even icmp echo (as for icmp), and the entire trace process will stop at such a firewall. To bypass the network filter, we need to use only combinations of the allowed protocol/port pair. If we do a trace, say, to the mail server, then it is very likely that with the help of -T -p 25 we can reach it, even if with the help of -I it is impossible to do it.
This method uses the well-known ‘half-open connection technique’, thanks to which applications on the destination computer do not see our probes packages at all. Normally sent tcp syn. For ports that are not listened, we get the answer tcp reset – and everything is ready. For actively listening ports, we get tcp syn+ack, but tcp reset is answered (instead of the expected tcp ack), so the remote tcp session is reset, and the application listening on the port does not even receive a notification.
There are several options for the tcp method:
syn,ack,fin,rst,psh,urg,ece,cwr
Sets certain tcp flags for a probe package, any combination of these can be used.
flags=NUMBER
Sets the flag field in the tcp header to the exact NUMBER.
ecn
Sends a syn packet with tcp ECE and CWR flags (for Explicit Congestion Notification, rfc3168).
sack,timestamps,window_scaling
Uses the appropriate tcp header option in the outgoing probe packet.
sysctl
Uses the current sysctl settings (/proc/sys/net/*) for the tcp header options for the above options and ecn. Always set to default if nothing is specified.
mss=NUMBER
Use the value NUMBER for the tcp option of the maxseg header (when syn).
info
Print the tcp flags of the final tcp responses when the target host is reached. Helps determine if an application is listening on a port and other useful things.
The default options are syn,sysctl.
tcpconn
The initial implementation of the tcp method simply using a call to connect(2), which opens a full tcp session. Not recommended for normal use, as it always affects the application listening port on the destination host.
To enable this method, use the -M tcpconn option.
udp
It uses udp datagrams with a fixed destination port (default is 53, dns). Also designed to bypass firewalls. To use this tracing method, specify the -M udp option or the abbreviated -U option.
Please note that unlike the tcp method, the corresponding application on the destination host always receives our probes (with random data) which can confuse it. In most cases, it will not respond to our packets, so we will never see the last hop (node) in the trace path. (Fortunately, it seems that at least the DNS servers are sending some kind of response).
This method does not require elevated rights.
udplite
Udplite uses datagrams for probes (with a fixed destination port, the default is 53). To activate this method, specify the -M udplite or -UL option.
This method does not require elevated rights.
Options:
coverage=NUMBER
Sets the coverage to send udplite to NUMBER.
dccp
Uses DCCP Request packets for probes (rfc4340). This method can be used with the -M dccp or -D options.
This method uses the same ‘half-open connection technique’ that is used for TCP. The default destination port is 33434.
Options:
coverage=NUMBER
Sets the DCCP service code to NUMBER (the default is 1885957735).
raw
This method sends raw packets of the specified protocol. To call this method, use the -M raw or -P PROTOCOL option.
Transport-specific headers are not used, only IP protocol headers.
Implies -N 1 -w 5.
Options:
protocol=PROTOCOL
Use IP PROTOCOL (default 253).
A list of protocols encapsulated in IP on Wikipedia, in the original source.
How to speed up tracing. How to disable reverse IP to host name translation during tracing
Slightly above the principles of the trace are described – sending packets with an ever-increasing TTL. In fact, all packets (with TTL 1, with TTL 2, with TTL 3, etc.) can be sent simultaneously. And this is exactly what happens – by default, 16 packets are sent at a time (the number can be changed with the -N option). This is done to speed up tracing.
Therefore, in reality, tracing is very fast. Those 1-2 seconds, which we think are spent to discover the network nodes, are actually spent on obtaining host names for IP. This can be disabled with the -n option.
Using the time program, you can measure the program execution time with the -n option and without it:
time traceroute -n google.com

time traceroute google.com
The execution time of the trace itself is 0.206s, and the time trace + IP to hostname mapping turned out to be 2,360s, that is, 10 times longer.
IPv6 tracing
By default, the program obtains an IP for the host specified for tracing and, based on the obtained IP address, automatically determines which protocol is used: IPv4 or IPv6. If IPs are received for both protocols, then IPv4 is used by default.
Using the -4 and -6 options, you can explicitly specify the desired protocol.
For example:
traceroute -6 -n google.com

The network from which tracing is done with the -6 option must support IPv6, otherwise it will not work.
How to change port for tracing
You can change the destination port using the option:
-p PORT, --port=PORT
For UDP tracing, the specified port will be used as the base port (the destination port number will increase for each probe).
For ICMP traces, the specified number will be used as the initial ICMP sequence value (also increased for each probe).
For TCP and other, the specified port will be used as the permanent destination port to which you want to connect.
This is usually not required, but you can also specify the source port, this is done with the option:
--sport=PORT
This option implies -N 1 -w 5. Normally, the source ports (if applicable to the selected tracing method) are selected by the system.
How to start tracing from a specific hop. How to reduce or increase the number of hops to trace
With the -f option, you can specify the node number from which to start tracing. The default value is 1.
With the -m option, you can specify the maximum number of hops for tracing, the default is 30.
Select interface for tracing
By default, packets are sent from the interface for which the default route is configured. But the following option can be made so that traceroute will send packets from the interface specified in the command line:
-i INTERFACE, --interface=INTERFACE
How to show which autonomous system the node belongs to when tracing
Each IP address is bound to an Autonomous System (AS). Using the -A option, you can enable the mapping of the AS number for each node along the trace path, for example:
sudo traceroute -A -n suip.biz
Example output:
 1  192.168.1.1 [AS198949]  1.102 ms  1.708 ms  2.720 ms
 2  10.20.48.1 [*]  7.121 ms  7.168 ms  11.242 ms
 3  10.246.245.241 [*]  15.368 ms  15.812 ms  15.788 ms
 4  10.185.252.29 [*]  16.243 ms  16.213 ms  16.181 ms
 5  58.97.121.237 [AS38082/AS7470]  16.802 ms  16.776 ms  16.976 ms
 6  171.102.247.244 [AS38082/AS7470]  17.405 ms 171.102.247.114 [AS38082/AS7470]  16.320 ms 171.102.247.74 [AS38082/AS7470]  21.324 ms
 7  171.102.250.1 [AS38082/AS7470]  20.946 ms  20.521 ms  21.542 ms
 8  171.102.254.232 [AS38082/AS7470]  21.896 ms  22.789 ms  23.755 ms
 9  171.102.250.156 [AS38082/AS7470]  23.431 ms  23.036 ms  24.393 ms
10  122.155.224.197 [as4651]  26.448 ms 122.155.226.85 [as4651]  25.531 ms 122.155.226.89 [as4651]  26.770 ms
11  61.19.9.66 [AS4651/AS3549]  76.868 ms  77.298 ms  56.532 ms
12  * * *
13  87.226.181.87 [AS12389]  306.596 ms  306.452 ms 87.226.183.87 [AS12389]  306.332 ms
14  81.177.108.86 [AS12389]  307.373 ms  307.322 ms  307.328 ms
15  94.142.138.40 [AS48666]  307.290 ms  307.268 ms  307.211 ms
16  185.117.153.79 [AS48666]  307.185 ms  307.181 ms  306.512 ms
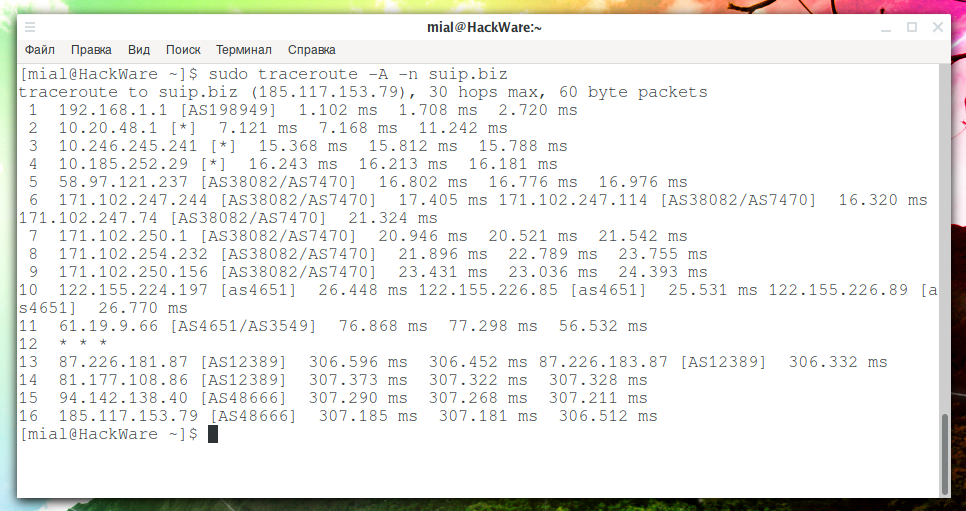
As you can see, the autonomous system is not defined for local IP 10.*.*.* - which is quite logical, since these addresses are not assigned to anyone. As for the address 192.168.1.1 and the autonomous unit AS198949, this is some kind of error.
As you can see from the output of the previous command, the first four nodes have local IP addresses. Nodes 5 through 9 belong to one AS38082/AS7470 autonomous system. The penultimate two nodes belong to the same AS12389 autonomous system and the last two nodes also belong to the same AS48666 autonomous system too — the Internet provider that hosts the suip.biz website.
Traceroute options
The traceroute command has other options that may be useful to you. You can read them in the help page of this program:
man traceroute
tracepath
The tracepath program is similar to traceroute, but uses only one trace technique: UDP, for which you can specify a port. Due to the chosen technique, the program does not require elevated privileges.
Launch example:
tracepath suip.biz
Example output:
 1?: [LOCALHOST]                      pmtu 1500
 1:  _gateway                                              1.247ms
 1:  _gateway                                              1.031ms
 2:  10.20.48.1                                            9.097ms
 3:  10.246.245.241                                       14.034ms
 4:  10.185.252.194                                       14.379ms
 5:  10.185.252.29                                        11.530ms asymm  4
 6:  58-97-121-237.static.asianet.co.th                   13.849ms asymm  5
 7:  171-102-247-184.static.asianet.co.th                 15.737ms asymm  6
 8:  171-102-250-1.static.asianet.co.th                   64.185ms asymm  7
 9:  171-102-254-232.static.asianet.co.th                 14.962ms asymm  8
10:  171-102-250-156.static.asianet.co.th                 13.509ms asymm  9
11:  122.155.226.89                                       18.793ms
12:  61.19.9.66                                           58.829ms
13:  no reply
14:  87.226.181.87                                       399.972ms asymm 23
15:  81.177.108.86                                       263.969ms asymm 14
16:  j37-ae9-3001.marosnet.net                           307.140ms
17:  suip.biz                                            304.644ms reached
     Resume: pmtu 1500 hops 17 back 17
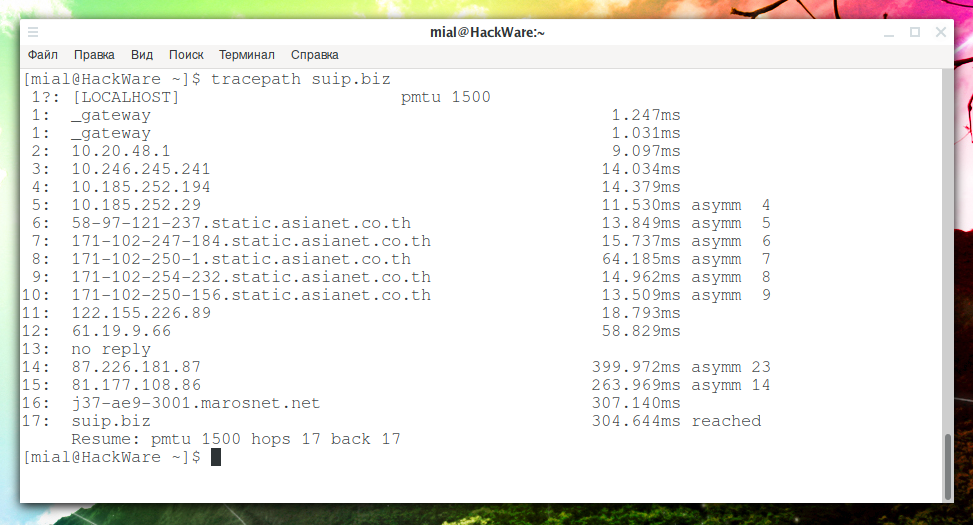
In the first column, next to the node number, there may be a question mark – it means that the TTL number is missing from the reply and the program tries to guess it.
Instead of asterisks, if the IP is not recognized, it is written ‘no reply’.
The last column can be a number and the word asymm. The word asymm means that the route is asymmetric – that is, from us to this node, the package goes along one path, and from this node to us the packet passes along another path. Digits mean the possible number of hopes from this node to us – but the information is not reliable.
Tracepath doesn't have many options:
-4
Use IPv4 only
-6
Use IPv6 only
-n
Do not print the host name, but print the numeric IP value.
-b
Print both the host name and IP address numerically.
-l
Set the initial packet length instead of 65535 for tracepath or 128000 for tracepath6.
-m
Set the maximum number of hops (or maximum TTL) – that is, the number of “knockout” nodes. The default is 30.
-p
Set the initial destination port.
mtr and mtr-gtk (console and graphic version)
The mtr program combines the functionality of the traceroute and ping programs in a single network diagnostic tool. That is, this program shows the route to the specified node and continuously pings every hop and at the same time collects general loss statistics — based on this data, you can determine the problem node where packets are lost.
Luanch example:
mtr suip.biz
Example output:
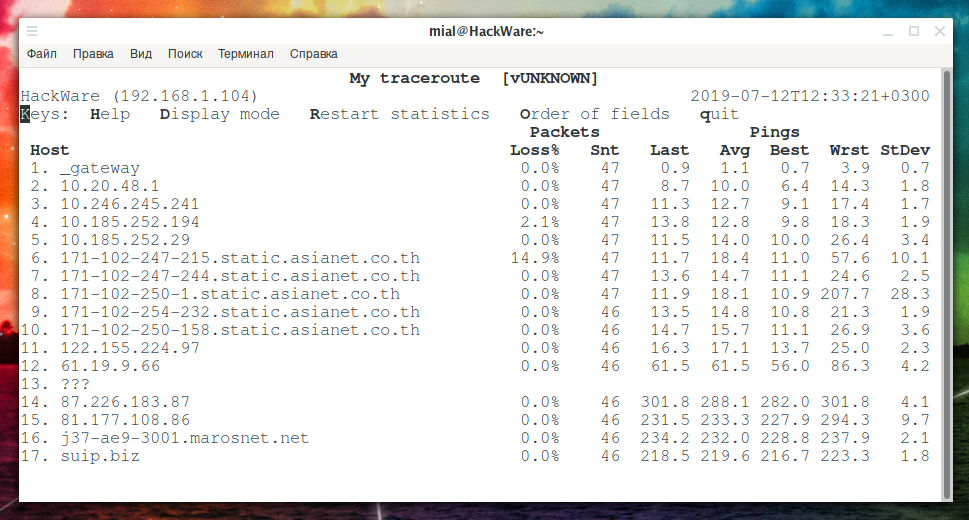
This program supports several tracing methods.
It also supports various output formats for saving results, for example, the -C, --csv option for saving results in CSV format (note that the semicolon rather than a comma is used as a separator), as well as the -j, --json option to save as JSON output format.
With the -n, --no-dns option, you can disable IP to host name conversion.
With the -b, --show-ips option you can enable the display of both host names and IP addresses.
The option -y n, --ipinfo n allows you to configure the output of additional information about each IP hop. As n you need to specify the number, which means:
	0 Show autonomous system number (AS) (equivalent to -z)
	1 Show IP Prefix
	2 Show AS-based country code
	3 Show RIR (ripencc, arin, ...)
	4 Show IP prefix allocation date
For all values of -y, I only see the autonomous system number. Fortunately, between different views, you can switch in a circle using the y button:

The -z, --aslookup option displays the Autonomous System (AS) number for each hop.
The -f NUM option is used to set the first TTL number. The default is 1.
The -m option specifies the maximum number of hops (the maximum time-to-live value) that will be processed during tracing. The default is 30.
The -U NUMBER option sets a maximum of unfamiliar hosts. The default is 5. Apparently, after reaching this value, further tracing will be stopped.
With the -u, --udp option, the program will use UDP datagrams instead of ICMP ECHO.
And with the -T, --tcp option you can set to use TCP SYN packets instead of ICMP ECHO. PACKETSIZE is ignored because SYN packets cannot contain data.
In mtr, you can even use the SCTP protocol for tracing. To do this, specify the -S, --sctp option and the Stream Control Transmission Protocol packages will be used instead of ICMP ECHO.
Ports:
	-P PORT, --port PORT
		The target port number for TCP/SCTP/UDP traces.

	-L LOCAL_PORT, --localport LOCAL_PORT
		Source port number for UDP traces.
During the program, interactive commands are available. If you click on d, you can switch between different views:
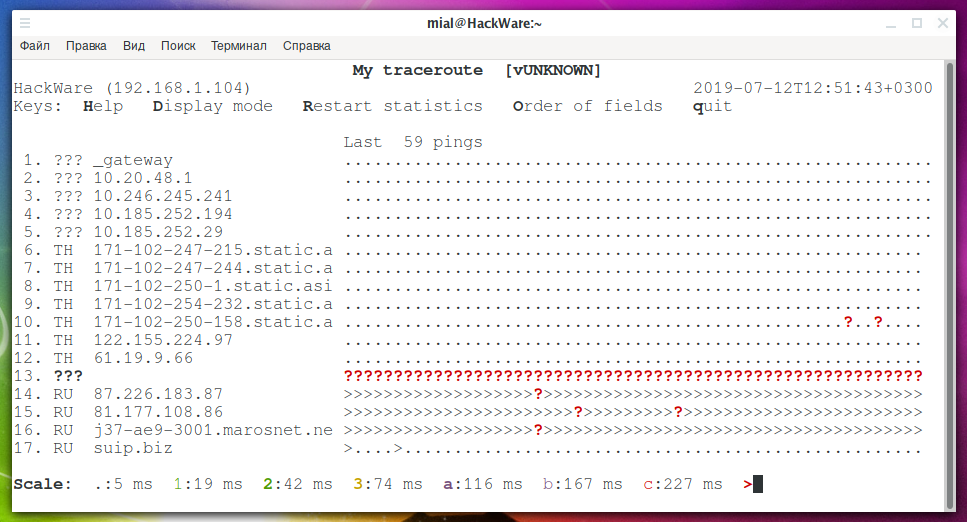
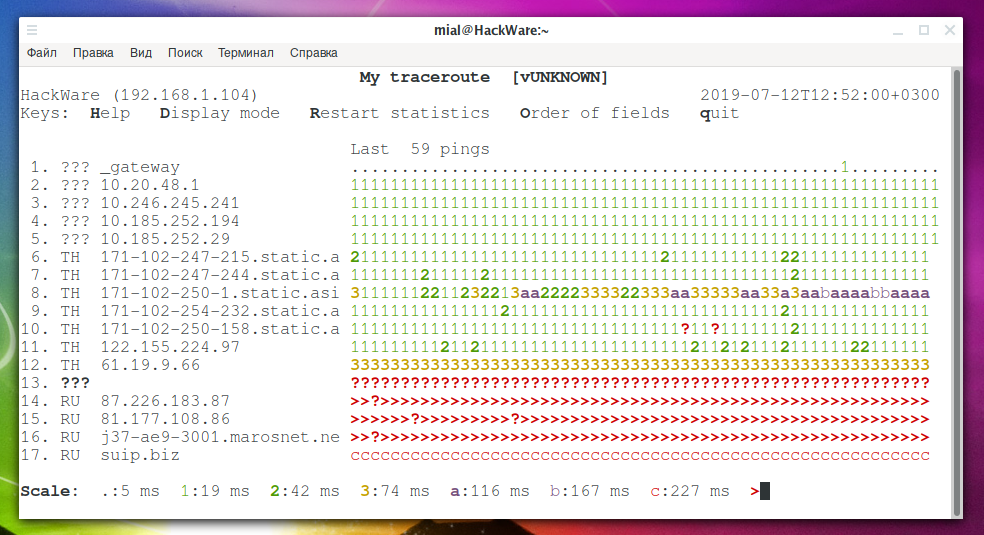
The r button can reset statistics.
With the o button you can change the order of the fields. By the way, with the -o option you can set which fields you want to display and their order. See details by:
man mtr
lft
The lft program has many trace options and it follows from the description that the program tries several combinations and automatically selects the best solution. Honestly, I did not notice this: the results with manual enumeration of different tracing methods allow you to choose the best option.
The program is well documented and, if desired, can be used as an alternative to traceroute.
tcptraceroute
The tcptraceroute program uses packets of only one TCP protocol. You can set different flags in the headers of these packages with options. In the traceroute program, you can also set TCP protocol flags, with more options to configure.
Tracerouting in Nmap
In Nmap for tracing there is an option --traceroute, an example of tracing to the suip.biz site:
sudo nmap --traceroute suip.biz
If you do not want to scan ports, but simply want to perform a trace, then add the -sn option:
sudo nmap --traceroute -sn suip.biz
By the way, this significantly reduces the time to output the results.
It happens that the data displayed during the tracing program nmap are not complete. In this case, try additionally adding the -PE option:
sudo nmap --traceroute -sn -PE suip.biz
In Nmap, you can set options in the IP protocol packet header. Among these options there is one that saves the route passed in the packet header. But this option has a number of limitations:
- only 9 slots
- some devices ignore this option
- some devices do not pass packets with this option set
However, sometimes it works, an example of the command:
sudo nmap -sn --ip-options "R" -n --packet-trace suip.biz
Example output:
Binary ip options to be send:
\x01\x07\x27\x04\x00\x00\x00\x00 \x00\x00\x00\x00\x00\x00\x00\x00
\x00\x00\x00\x00\x00\x00\x00\x00 \x00\x00\x00\x00\x00\x00\x00\x00
\x00\x00\x00\x00\x00\x00\x00\x00
Parsed ip options to be send:
 NOP RR{#0.0.0.0 0.0.0.0 0.0.0.0 0.0.0.0 0.0.0.0 0.0.0.0 0.0.0.0 0.0.0.0 0.0.0.0}
Starting Nmap 7.70 ( https://nmap.org ) at 2019-07-12 18:02 MSK
SENT (0.8154s) ICMP [192.168.1.57 > 185.117.153.79 Echo request (type=8/code=0) id=64674 seq=0] IP [ttl=42 id=53218 iplen=68 ipopts={ NOP RR{#0.0.0.0 0.0.0.0 0.0.0.0 0.0.0.0 0.0.0.0 0.0.0.0 0.0.0.0 0.0.0.0 0.0.0.0}}]
SENT (0.8154s) TCP 192.168.1.57:36579 > 185.117.153.79:443 S ttl=43 id=9871 iplen=84 ipopts={ NOP RR{#0.0.0.0 0.0.0.0 0.0.0.0 0.0.0.0 0.0.0.0 0.0.0.0 0.0.0.0 0.0.0.0 0.0.0.0}} seq=1013479372 win=1024 <mss 1460>
SENT (0.8154s) TCP 192.168.1.57:36579 > 185.117.153.79:80 A ttl=41 id=45814 iplen=80 ipopts={ NOP RR{#0.0.0.0 0.0.0.0 0.0.0.0 0.0.0.0 0.0.0.0 0.0.0.0 0.0.0.0 0.0.0.0 0.0.0.0}} seq=0 win=1024
SENT (0.8155s) ICMP [192.168.1.57 > 185.117.153.79 Timestamp request (type=13/code=0) id=32210 seq=0 orig=0 recv=0 trans=0] IP [ttl=55 id=35087 iplen=80 ipopts={ NOP RR{#0.0.0.0 0.0.0.0 0.0.0.0 0.0.0.0 0.0.0.0 0.0.0.0 0.0.0.0 0.0.0.0 0.0.0.0}}]
RCVD (1.1526s) ICMP [185.117.153.79 > 192.168.1.57 Echo reply (type=0/code=0) id=64674 seq=0] IP [ttl=48 id=44985 iplen=68 ipopts={ RR{ 10.246.245.242 10.185.252.193 10.185.252.29 10.185.0.12 171.102.250.3 171.102.250.128 203.144.128.48 203.144.144.8 103.3.177.50#} EOL}]
Nmap scan report for suip.biz (185.117.153.79)
Host is up (0.34s latency).
Other addresses for suip.biz (not scanned): 2a02:f680:1:1100::3d5f
Nmap done: 1 IP address (1 host up) scanned in 1.20 seconds
Pay attention to the line:
RCVD (1.1526s) ICMP [185.117.153.79 > 192.168.1.57 Echo reply (type=0/code=0) id=64674 seq=0] IP [ttl=48 id=44985 iplen=68 ipopts={ RR{ 10.246.245.242 10.185.252.193 10.185.252.29 10.185.0.12 171.102.250.3 171.102.250.128 203.144.128.48 203.144.144.8 103.3.177.50#} EOL}]
It lists the first 9 nodes through which the packet passed.
Ping tracing
The ping program can also record a route — to do this, you need to start the program with the -R option. It adds the RECORD_ROUTE option to the ECHO_REQUEST packet and displays the route buffer of the returned packets. This is the same option that Nmap uses. The limitations are the same: a maximum of 9 slots, many hosts ignore or discard this option.
Launch example:
ping -R suip.biz
Example output:
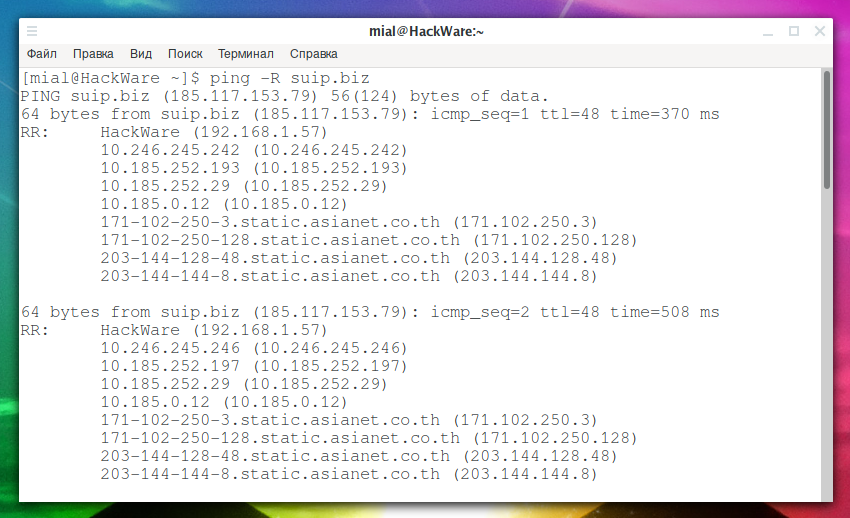
IPs are displayed at each ping. If the route does not change, then an inscription is displayed that the route has not changed (same route).
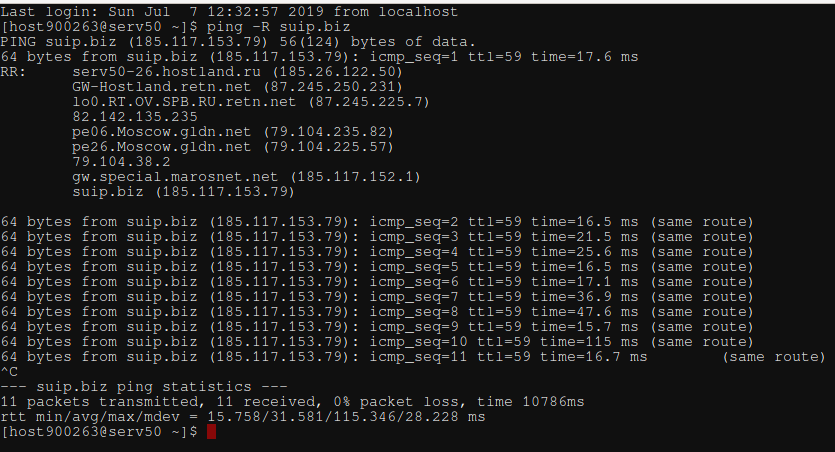
Despite all the limitations of the RECORD_ROUTE option, sometimes it is the only option to get at least some information about the route, since the ping command is almost always present and does not require root privileges to run.
Windows tracerouting
On Windows, tracert is built in to trace a network. She has almost no options. To run the command, it is enough to specify the name of the remote host:
tracert suip.biz
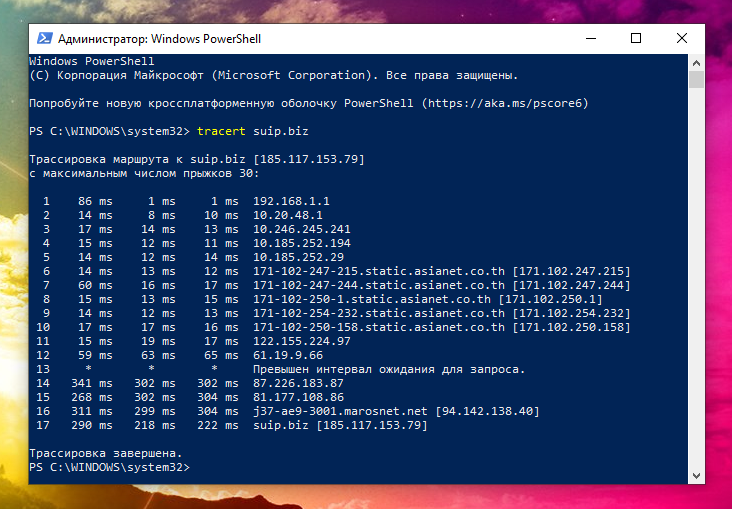
If this functionality is not enough for you, then you can install Nmap in Windows.
Conclusion
Tracing can be useful for discovering the network structure (for example, your ISP's network), as well as for correcting problems with data transmission (for example, to determine the node, beyond which the packets do not pass).
The richest in functionality for network tracing is the traceroute program. Other programs also contain interesting options or can be used as alternatives if nothing else is available or if another programs require superuser privileges.
Related articles:
- Best Kali Linux tools in WSL (Windows Subsystem for Linux) (Part 1) (77.5%)
- Utilities for information gathering, OSINT and network analysis in Windows and Linux (75.8%)
- How to find out local IP addresses of ISP (72.4%)
- Tracerouting networks with complex topology. How to detect NAT (71.8%)
- Port scanner for Windows (61%)
- How to Install and run WPScan on Windows (RANDOM - 3.9%)